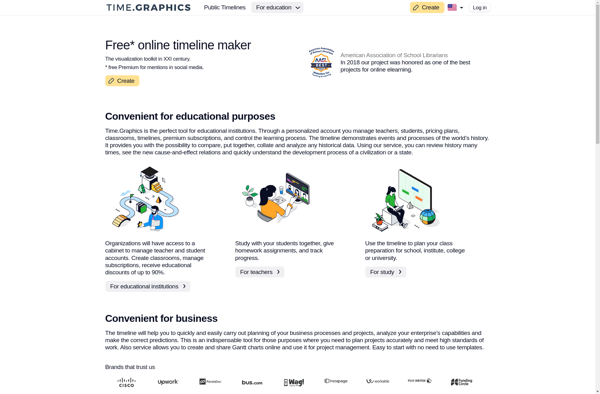
Time.Graphics is a flexible online timeline maker that allows users to visually map out chronological events on interactive timelines. It has a simple drag-and-drop interface to add events, customize designs, and share timelines.
A flexible online timeline maker for visually mapping out chronological events on interactive timelines with a simple drag-and-drop interface, customizable designs, and sharing capabilities.
What is Time.Graphics – flexible timeline?
Time.Graphics is an easy-to-use online tool for creating visually compelling interactive timelines. With its intuitive drag-and-drop interface, anyone can quickly map out the chronology of past events or plans for the future. You simply add timeline points for key occurrences or milestones, write a title and description for each point, and Time.Graphics handles the rest.
One of the best features of Time.Graphics is flexibility. You can choose from a variety of templates and color schemes to match your brand or aesthetic. The tool also gives you control over the time scale, allowing you to zoom in on specific periods or view the full span of events. Interactive controls let you highlight different points or collapse sections of the timeline.
Time.Graphics timelines can be easily shared with colleagues, students, or the general public with a simple link or embed code. The service is free to use with basic features, while premium plans provide additional customization and privacy options as well as expanded storage. For presenting chronological sequences in a visual way, Time.Graphics is an excellent choice.
Time.Graphics – flexible timeline Features
Features
Flexible timeline creation with a drag-and-drop interface
Customizable designs and themes
Ability to add events, text, images, and links to the timeline
Collaborative features for sharing and editing timelines
Export timelines as images or embed them on websites
Mobile-responsive design for viewing on various devices
Pricing
Free
Subscription-Based
Pros
Easy to use and intuitive interface
Wide range of customization options
Collaborative features for team projects
Ability to embed timelines on websites
Cons
Limited free plan with limited features
Subscription-based pricing model for advanced features
Potential learning curve for more complex timeline creation
Timeline is a free, open-source personal timeline and journal software for Windows, Mac, and Linux. It allows users to visually map out past and future events in their lives.With Timeline, users can create colorful, customizable timelines by adding events, photos, videos, audio clips, documents, and more. Events can be categorized...
Aeon Timeline is a feature-rich timeline creation software developed by Scrivenerlabs for Windows. It provides users with a flexible canvas to visualize histories, biographies, stories, processes, and more in an interactive timeline format.Key features of Aeon Timeline include:Intuitive drag-and-drop interface to add and organize timeline eventsVarious timeline views like linear,...
Timeline JS is an open-source web tool created by Northwestern University's Knight Lab that allows users to build interactive timelines. It is designed for storytelling and allows creators to incorporate text, images, videos, maps, and other multimedia into visually-rich timelines that are easy to navigate.The tool provides a simple interface...
Tiki-Toki is a free web-based application for building interactive, media-rich timelines. Its key features include:Drag-and-drop timeline creation interface to easily add timeline events with titles, descriptions, dates, images, videos, audio, maps and external linksHundreds of integrated media sources like Wikipedia, YouTube, Google Maps, Flickr to find media for your eventsChoose...
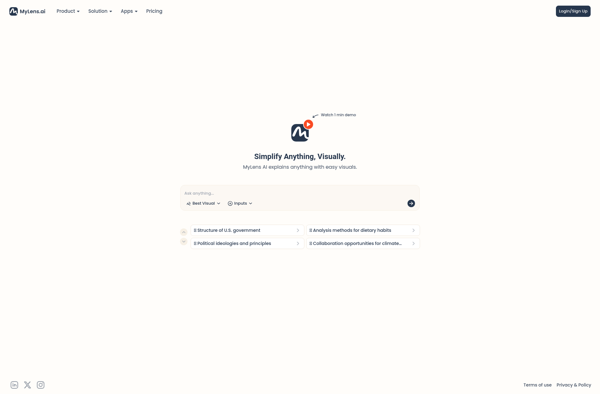
MyLens is a free, open-source alternative to expensive stock photography websites like Shutterstock or Getty Images. It provides access to a library of over 300,000 high quality, reusable images that are free from copyright restrictions.Unlike other stock sites, MyLens does not charge for image downloads or subscriptions. The platform is...
Sutori is a web-based educational platform designed to help teachers and students create visually engaging interactive timelines and stories. Some key features of Sutori include:Collaborative timelines - Multiple students can collaborate on a single timeline, adding events, descriptions, images, videos and more. Teachers can track student contributions.Customizable design - Users...
Timetoast is an easy-to-use online tool for creating interactive timelines. It allows users to build visually compelling timelines by simply dragging and dropping timeline events onto a timeline editor. Timetoast has a intuitive interface that makes it simple for anyone to build timelines, no design experience required.Some key features of...
Preceden is a user-friendly online software for creating interactive timelines, roadmaps, family trees, and other visual narratives. With Preceden, users can:Build unlimited timelines for free, with the ability to upgrade to paid plans for additional featuresAdd text, photos, videos, maps, Wikipedia entries, and more to events on a timelineCustomize the...
Timli is a cloud-based time tracking and productivity management software designed specifically for freelancers, agencies, consultants and other service-based businesses. It allows users to accurately track time spent on projects, manage tasks and deadlines, generate detailed reports on productivity and profitability, create professional invoices, and get paid faster.Some of the...
TimeRime is a versatile time tracking and productivity platform aimed at freelancers, agencies, consultants, and other service-based businesses. Its key features include:Time Tracking - Automatically track time spent on tasks and projects. Tag timesheets with projects, clients, tasks, etc.Productivity Analysis - Generate insightful reports on where your time is being...
ChronoFlo Timeline is a feature-rich timeline creation software designed to help users build visually engaging interactive timelines with ease. With an intuitive drag-and-drop interface, users can create unlimited events on the timeline and customize them with various media elements including text, images, videos, audio clips, maps, external links, etc.Some key...