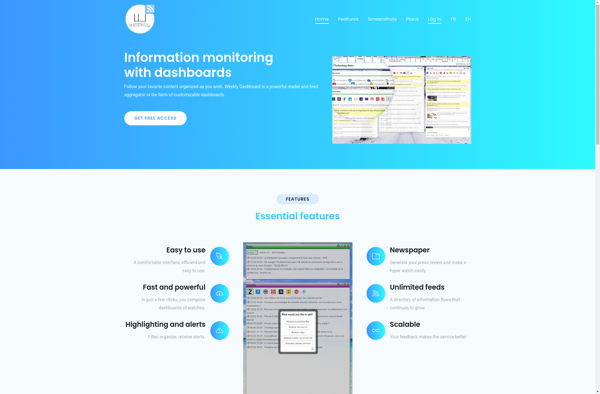
Weekly Dashboard is a data visualization and analytics software that allows users to create interactive dashboards to track KPIs. It has drag-and-drop functionality to build charts, graphs and other data visualizations that auto-update as new data comes in.
Weekly Dashboard: Data Visualization and Analytics Software
A software tool for creating interactive dashboards to track KPIs, with drag-and-drop functionality to build charts and graphs that auto-update with new data.
What is Weekly Dashboard?
Weekly Dashboard is a business intelligence and analytics software used by organizations to visualize important metrics and key performance indicators (KPIs). It provides an intuitive drag-and-drop interface to build interactive dashboards that can combine charts, graphs, tables, scorecards and other data visualizations.
The dashboards in Weekly Dashboard connect directly to the company's data sources such as SQL, MySQL, Postgres databases, data warehouses, cloud applications, Excel files and more. As new data flows into these sources, the dashboards and underlying visuals auto-update to provide real-time insights.
Some key features of Weekly Dashboard include:
Drag-and-drop dashboard designer to easily create and customize dashboards
Library of pre-built dashboard templates for common use cases
Automated data connectivity to eliminate manual reporting and updates
Interactive visualizations like charts, graphs, heat maps and more
Collaboration tools to discuss insights with annotations and comments
Role-based access control to securely share dashboards
Scheduling and distribution options via TVs, emails, apps and more
Pixel perfect reporting for print-ready PDFs and presentations
Mobile optimization to view and interact with dashboards on any device
Overall, Weekly Dashboard makes it easier for organizations to visualize data, spot trends and insights, track KPIs and make data-driven decisions. Its user-friendly interface allows dashboard creation in minutes without any coding.
Weekly Dashboard Features
Features
Drag-and-drop interface to build dashboards
Pre-built dashboard templates
Customizable charts and graphs
Real-time data visualization
Schedule and email reports
Access controls and sharing
Integration with databases and APIs
Mobile app to view dashboards on the go
Pricing
Freemium
Subscription-Based
Pros
Intuitive and easy to use
Great for visualizing trends and insights
Flexible formatting options
Scales to large data sets
Collaboration features
Large library of widgets and templates
Cons
Steep learning curve for advanced features
Limited customization for branding
Requires technical skills for complex data integration
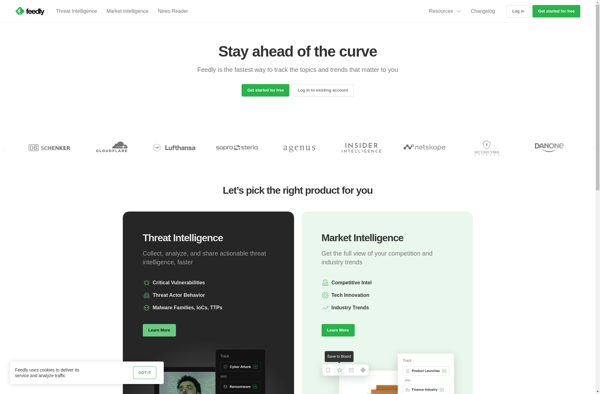
What Is Feedly?Feedly is an RSS reader and news aggregator that lets you follow websites, blogs, YouTube channels, podcasts, and keyword alerts in one place. It is the most popular RSS reader for professionals who need to stay on top of industry news and research.Key FeaturesFeedly organizes feeds into customizable...
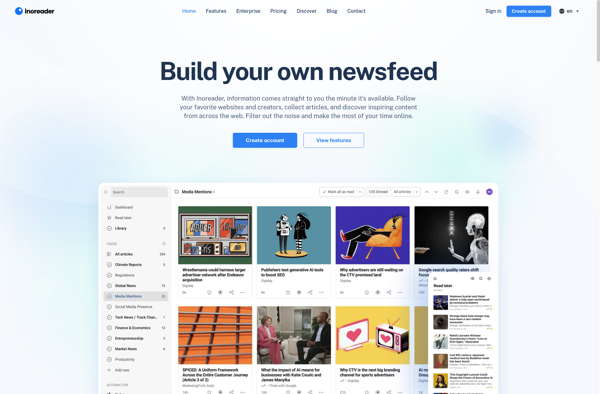
What Is Inoreader?Inoreader is a web-based RSS reader and content aggregator for following websites, blogs, podcasts, YouTube channels, and social media feeds in one place. It is one of the most feature-rich RSS readers available, popular among power users and researchers.Key FeaturesInoreader supports RSS, Atom, and JSON feeds with automatic...
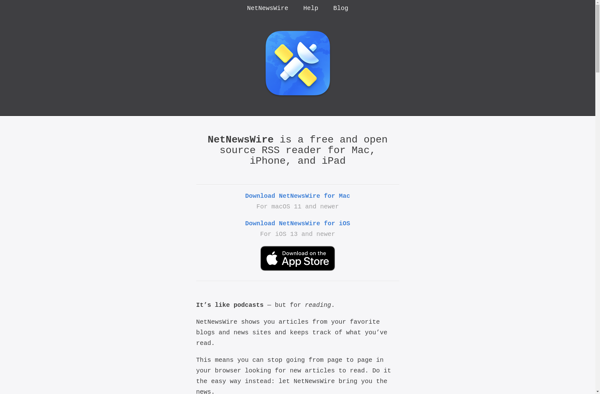
NetNewsWire is a free, open source RSS reader and podcast manager originally created by Brent Simmons and Black Pixel. It is available for Mac, iOS, and iPadOS devices and allows you to easily subscribe to RSS feeds from blogs, news sites, podcasts, YouTube channels, and more.Some key features of NetNewsWire...
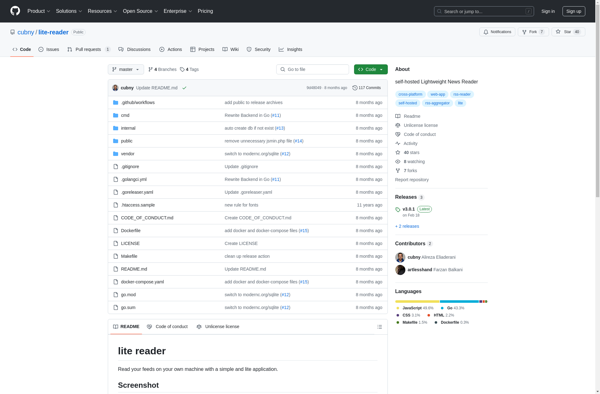
Lite-reader is a free, open-source, and ad-free RSS/Atom feed reader for Windows, Linux, and macOS. Developed with speed, simplicity, and resource efficiency in mind, it provides a fast and clean interface to view, manage, and organize both small and extremely large feeds.As an RSS reader, Lite-reader lets you subscribe to...
QuiteRSS is an open-source news feed aggregator application designed specifically for the Qt framework. It enables users to efficiently manage large numbers of RSS and Atom feeds in a visually pleasing graphical user interface.Some key features of QuiteRSS include:Support for RSS 0.91, 0.92, 1.0, 2.0 and Atom feedsAbility to categorize...
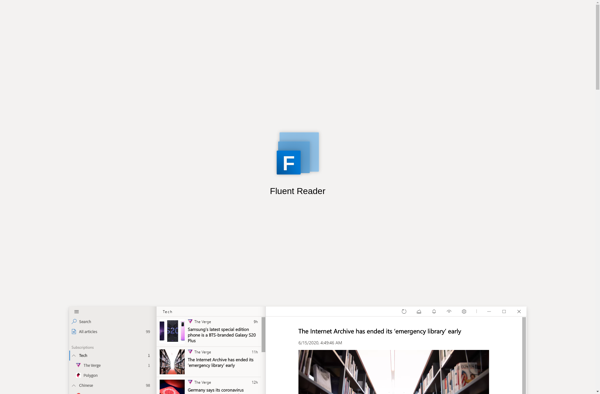
Fluent Reader is an open-source, cross-platform RSS reader and feed aggregator that allows you to subscribe to multiple RSS and Atom feeds in one place. It features a minimal and distraction-free reading interface to help you focus on reading content.Some of the key features of Fluent Reader include:Support for adding...
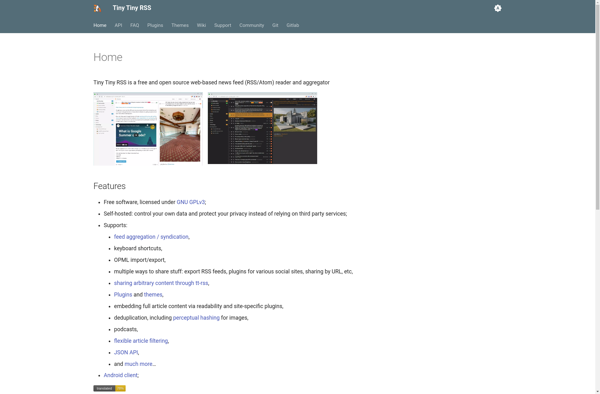
Tiny Tiny RSS is an open source web-based news feed (RSS/Atom) reader and aggregator. It is designed to allow users to read news and articles from any location through a web browser on desktop or mobile devices. Some key features include:Self-hosted - It can be installed on your own server...
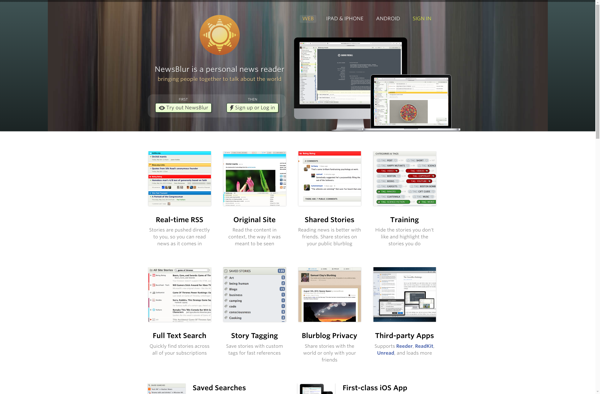
NewsBlur is a customizable, web-based feed reader and news aggregator with powerful organization features. It allows users to subscribe to any number of RSS and Atom news feeds and blogs, and organizes articles into topics like technology, politics, science, and more using intelligent algorithms.Some key features of NewsBlur include:Feed recommendation...
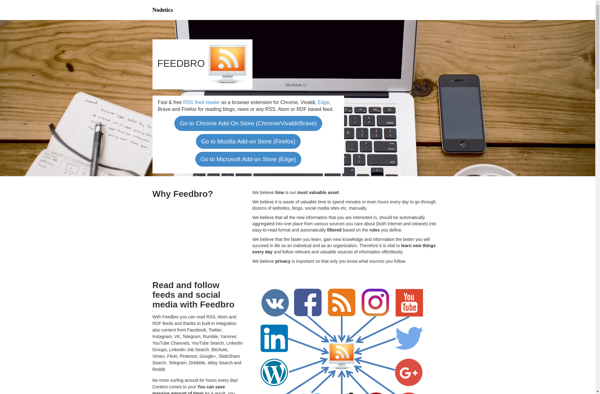
Feedbro is a free and open-source RSS feed reader browser extension available for Chrome, Firefox, and Safari. It helps you efficiently organize, follow, and read your favorite websites' RSS and Atom feeds right from your browser.Some key features of Feedbro include:Integration with services like Pocket, Wallabag, and Feedly for saving...
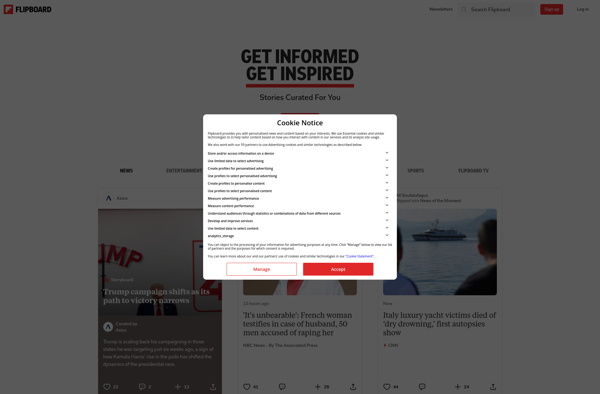
Flipboard is a popular news aggregation and content curation mobile and web application launched in 2010. It allows users to customize their feeds by selecting topics, sources, and social media accounts they are interested in following.When a user signs up, Flipboard asks them questions about their interests and preferences. Based...
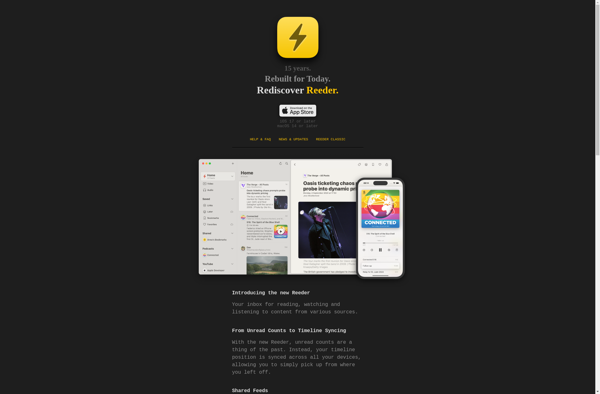
Reeder is a feature-rich yet easy to use RSS reader app for Mac and iOS devices. Originally launched in 2011 for iOS, it later expanded to the Mac in 2013. Reeder stands out for its clean and intuitive interface that makes reading RSS feeds a pleasure.Some key features of Reeder...
Feeder is a free, open source RSS feed reader developed specifically for the Windows platform. At its core, it provides all the essential functionality you would expect from an RSS reader - subscribing to feeds, categorizing them into folders, and reading feed items in a unified view.Some of the key...
Claws Mail is a free, open source email client and news client for Linux and other Unix-like operating systems. It is designed to be lightweight, fast, and easy to use while still being highly customizable and supporting advanced features.Some key features of Claws Mail include:Support for POP3, IMAP, NNTP and...
NUNUX Reader is a versatile, customizable, and user-friendly eBook reader platform. As an open-source software, it is completely free to download and use. It supports all major eBook formats including PDF, EPUB, MOBI, CBZ, and CBR.Some of the standout features of NUNUX Reader include:Customizable fonts, colors, spacing, margins to enhance...
Bandtraq is an online service designed for musicians and music enthusiasts to help track, organize, and share information about artists and bands. It functions as a database of bands that users can add profiles for, including biographical details, discographies, links, photos, and more.Some key features of Bandtraq include:User profiles -...
JARR is an open-source alternative to Atlassian's JIRA software for issue and project tracking. It allows teams to plan, track, and release great software.Key features of JARR include:Kanban boards for visualizing work and limiting work-in-progressRoadmaps to connect strategic objectives to the features building towards those goalsCustomizable workflows to map business...
GrazeRSS is an open source web-based RSS feed reader and aggregator. It allows users to easily subscribe to any RSS or Atom feed on the web and organize those feeds into customizable categories and folders. Some of the key features of GrazeRSS include:Offline reading support - Articles can be saved...
Simple News Reader is an open-source, cross-platform RSS reader and news aggregator software. It provides a convenient way for users to subscribe to RSS feeds from their favorite websites and blogs and read new articles and content updates all in one place.Some key features of Simple News Reader include:Easy subscription...
FeedReady is a software-as-a-service platform focused on product feed optimization and management. It aims to help ecommerce brands and agencies improve the quality and performance of their product feeds on shopping sites, marketplaces, and paid advertising channels.Some key features of FeedReady include:Automated validation of feed files to identify issues with...
Creaky Coot is a free and open-source note taking and task management application. Originally released in 2008 by a small team of developers, it has gained a cult following among Linux users and open source enthusiasts.Some key features of Creaky Coot include:Creating and organizing text-based notesChecklists for keeping track of...