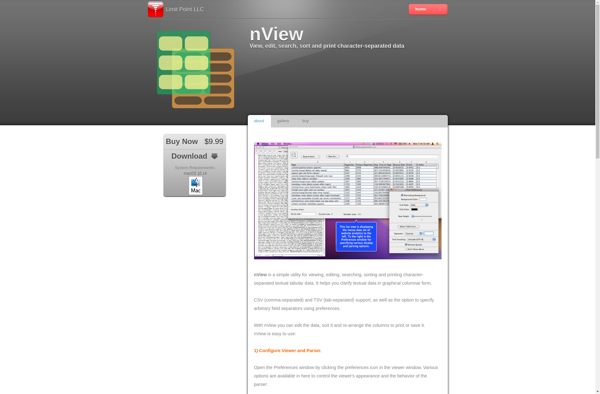
CSVboard
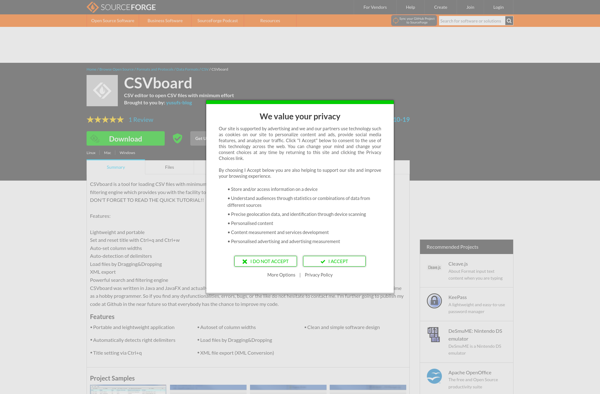
CSVboard: Visualize and Explore CSV Data
An open-source business intelligence tool with a simple drag-and-drop interface for building charts, tables, and dashboards from CSV files.
What is CSVboard?
CSVboard is an open-source business intelligence and data visualization tool designed specifically for CSV data. It allows users to easily explore, analyze, and visualize data from CSV files without the need for any coding or prior technical knowledge.
With its simple drag-and-drop interface, users can quickly build a variety of charts such as bar, line, scatter plots, pivots tables, and dashboards. Complex calculations and transformations can also be applied to the data via formulas. Dashboards can be shared with others or embedded into websites and apps.
As an open-source tool, CSVboard is completely free to use. It runs on Mac, Windows, and Linux operating systems. The software is built using Electron and JavaScript frameworks. It can handle very large CSV datasets while maintaining high performance. Files are processed locally for privacy.
CSVboard allows businesses, analysts, and researchers to tap into their wealth of CSV data and unlock insights without expensive BI tools. The easy-to-use interface makes it accessible for coders and non-coders alike. With support for exporting charts and dashboards, the analyses can be integrated into reporting processes or presentations.
CSVboard Features
Features
- Drag-and-drop interface for visualizing CSV data
- Variety of chart types including bar, line, pie, scatterplot, pivot table
- Filtering, sorting, formatting of data
- Collaboration - share dashboards and data
- Open source and self-hosted
Pricing
- Open Source
Pros
Cons
Official Links
Reviews & Ratings
Login to ReviewThe Best CSVboard Alternatives
Top Office & Productivity and Data Analysis and other similar apps like CSVboard
Here are some alternatives to CSVboard:
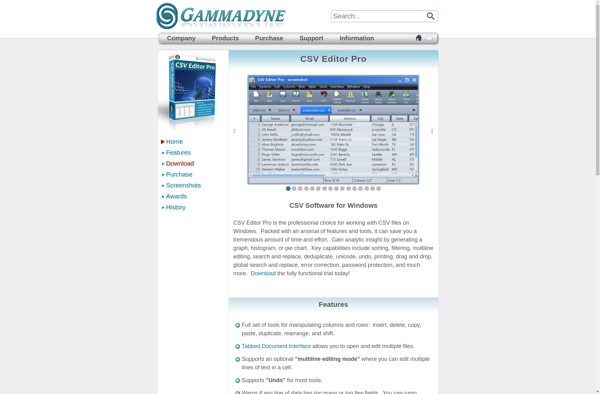
Suggest an alternative ❐CSV Editor Pro
EmEditor
CSVed
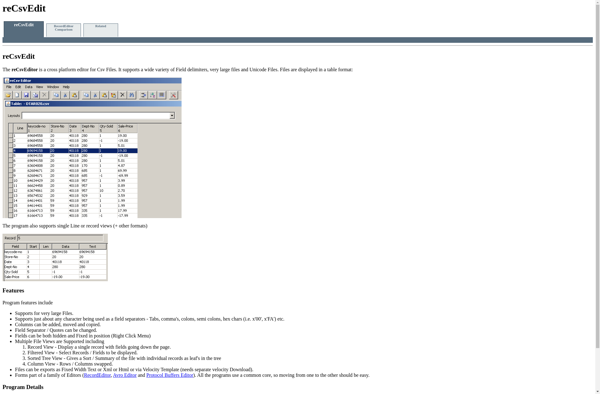
ReCsvEditor
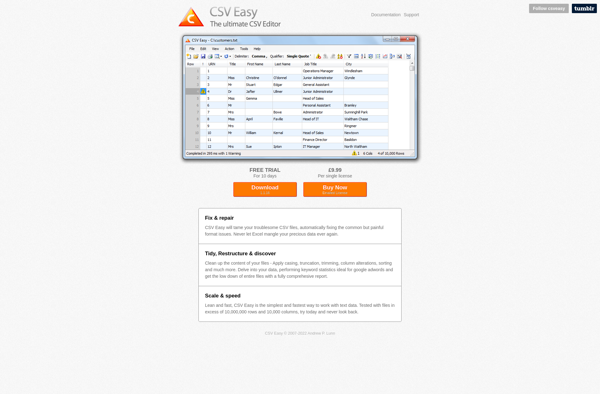
Csv Easy
CSV Quick Viewer
Delimit

CSV Query
CSVFileView
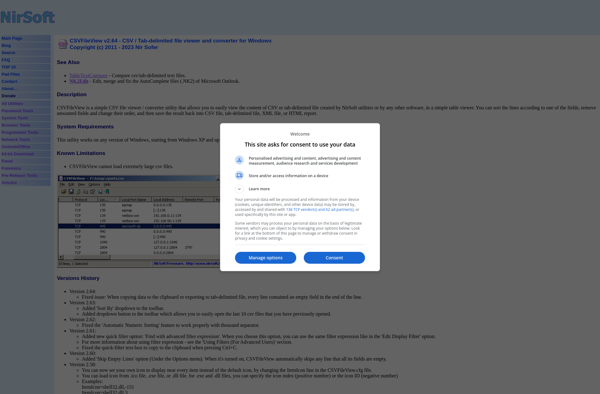
Easy CSV Editor

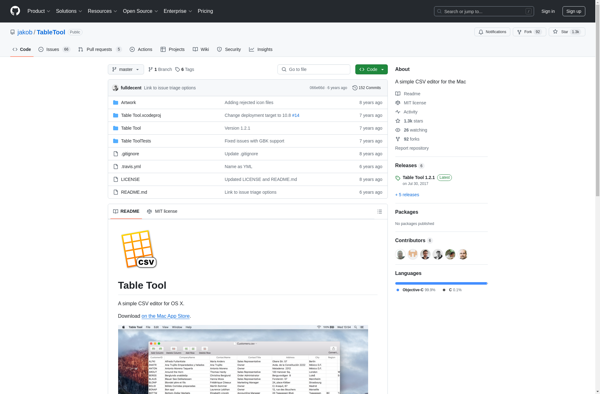
Table Tool
Tablecruncher
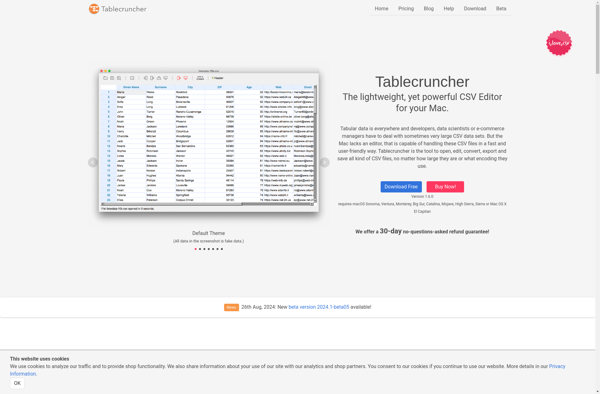
Table Editor
CSVpad

Dmcsveditor
CSV Buddy
Modern CSV
XTabulator
DB-Text

NView for Mac
